From Our Business Desk
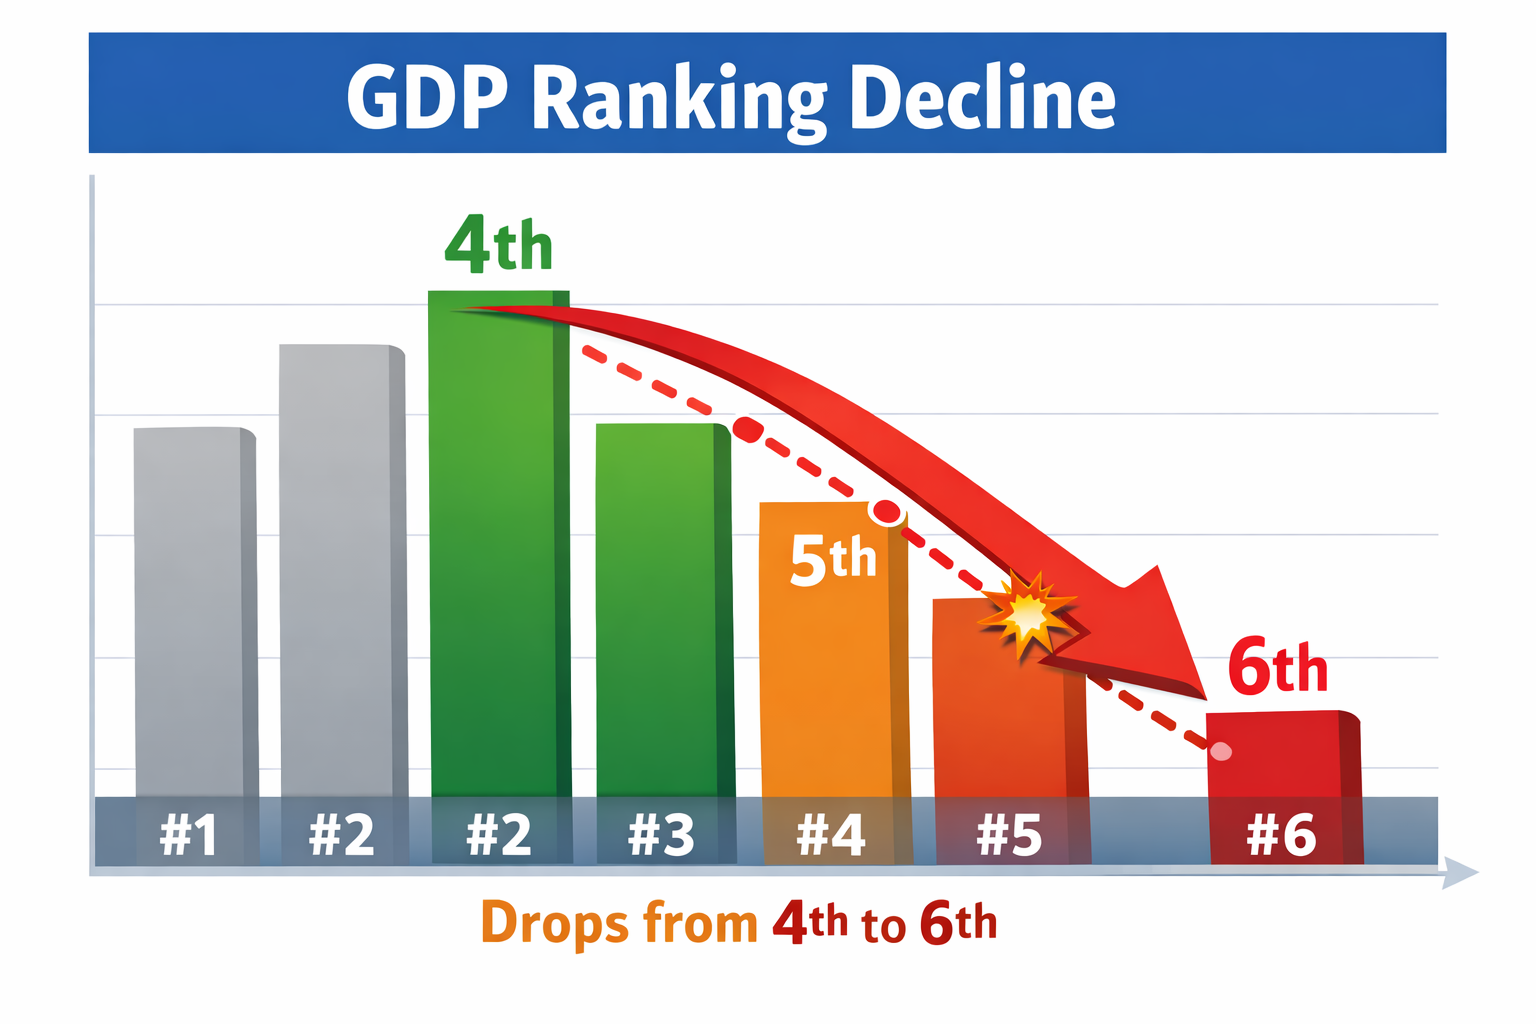
While supporters of the Modi government celebrated visions of a $5 trillion economy and India ascending to the third-largest global spot, the International Monetary Fund’s April 2026 World Economic Outlook delivered a corrective note. India slipped to sixth position in nominal GDP rankings, with an estimated $4.15 trillion, trailing the United States, China, Germany, Japan ($4.38 trillion), and the United Kingdom ($4.26 trillion). This reversal from earlier projections that had briefly placed India fourth underscores how nominal figures—converted at market exchange rates—can diverge sharply from underlying economic momentum. The drop stems primarily from sharp rupee depreciation and a revised GDP base year, not from any slowdown in real activity. India remains the fastest-growing major economy, with real GDP growth projected at around 6.5% for 2026.
The episode highlights a classic tension in emerging-market economics: robust domestic expansion can be masked in international comparisons by currency weakness and statistical adjustments. Critics have questioned whether government policies adequately addressed vulnerabilities such as import dependence and capital flow volatility. At the same time, India’s steadfast third-place ranking in Purchasing Power Parity (PPP) terms reveals the economy’s substantial domestic scale and resilience.
The Mechanics of the Nominal Slip
Nominal GDP rankings measure economic output in current US dollars. When the rupee weakens, the same rupee-denominated growth translates into fewer dollars, compressing India’s global position even as factories, services, and consumption expand. The February 2026 shift to a 2022-23 base year for GDP calculations further refined estimates, incorporating better data on the informal sector and digital economy. While this improved accuracy and slightly lifted real growth figures, it adjusted nominal levels downward in some projections, amplifying the ranking shift when combined with currency effects.
Projections indicate India could regain fourth place by 2027 and potentially reach third by around 2031, assuming sustained 6-7% real growth. The 2026 slip is thus largely technical—a reminder that headline rankings are sensitive to exchange rates rather than a verdict on fundamental health.
Causes of Rupee Depreciation: Structural and Cyclical Pressures
The rupee faced significant downward pressure through 2025 and into 2026, depreciating from around ₹84.6 per dollar in 2024 to levels near ₹92-94 by early 2026—an annual decline of roughly 9-11% in FY26. This was among the sharper drops in recent years and contributed directly to the nominal GDP compression.
Key drivers included:
Persistent Current Account Deficit (CAD) and Import Dependence: India imports over 80-85% of its crude oil needs, along with gold, electronics, fertilizers, and other essentials. Geopolitical tensions in West Asia, including US-Iran conflicts and disruptions in the Strait of Hormuz, pushed Brent crude above $110 per barrel at peaks. This inflated the import bill, widening the trade deficit. While services exports and remittances provide a buffer, they have not fully offset goods-side pressures. Export growth in PLI-supported sectors faced headwinds from global demand weakness and US tariffs on certain Indian goods.
Capital Outflows and FPI Exodus: Foreign portfolio investors pulled out record amounts—estimates range from $18-23 billion from equities in 2025 alone. Debt inflows and FDI remained subdued amid high valuations, domestic policy uncertainties, and the delayed resolution of a US-India trade deal. This created a balance-of-payments strain, with some periods showing deficits. India became one of Asia’s weaker-performing currencies despite strong real growth, as capital flows turned fickle.
Strong US Dollar and Global Factors: Elevated US interest rates and safe-haven demand bolstered the dollar. India’s interest-rate differential narrowed, reducing carry-trade appeal. Corporate hedging ahead of year-end and surges in gold imports added short-term pressure. The Reserve Bank of India (RBI) adopted a pragmatic approach—intervening to curb volatility (selling reserves at times) but allowing gradual depreciation rather than defending a rigid level. This avoided sharper shocks but permitted the slide.
Policy context plays a role here. Initiatives like Atmanirbhar Bharat and Production-Linked Incentives sought to boost manufacturing and reduce import reliance, yet results remain uneven, especially in energy and labor-intensive sectors. Fiscal policy maintained a consolidation path, but oil shocks tested subsidy burdens. Slower progress on deeper structural reforms in labor, land, and skills has kept the economy relatively services-oriented and exposed to CAD risks. Over-reliance on volatile portfolio flows, rather than more stable long-term FDI or diversified exports, amplified vulnerability. Geopolitical exposures without fuller energy or trade diversification further tested resilience.
In analytical terms, the depreciation reflects a classic emerging-economy challenge: strong real growth (6.5-7.6% in recent estimates) cannot always shield against external shocks when trade and capital accounts remain imbalanced. The RBI’s flexible stance was prudent, preventing a 2013-style crisis, but it highlighted gaps in building robust forex buffers and export competitiveness.
Nominal vs. PPP: Two Different Pictures of Economic Size
The contrast with Purchasing Power Parity rankings is instructive. While nominal GDP uses market exchange rates, PPP adjusts for differences in domestic price levels using an “international dollar” benchmark. It measures what India’s output can actually buy within the country, where costs for food, housing, services, and non-tradables are significantly lower than in advanced economies.
According to IMF April 2026 data, India’s PPP GDP stands at approximately $18.9 trillion—firmly in third place globally, behind only the United States (~$32.4 trillion) and China. This ranking has been stable for years, reflecting India’s massive domestic market and the volume of goods and services produced and consumed internally. In PPP terms, India overtook Japan years ago and maintains a clear edge over many higher-nominal economies like Germany.
The divergence arises because nominal metrics emphasize international purchasing power and are highly sensitive to forex fluctuations, while PPP better captures internal economic mass, living standards (adjusted for cost), and poverty-related metrics. India’s low per-capita income—around $2,813 nominal and ~$12,800 PPP—underscores that scale does not yet equate to widespread prosperity. Obsession with nominal rankings can fuel political rhetoric but risks overlooking that India’s real economic heft (third in PPP) remains intact despite rupee weakness. Depreciation hurts dollar-denominated comparisons and raises import costs (potentially feeding inflation), yet it has limited immediate impact on domestic purchasing power.
Is India Facing Recession? No—Fundamentals Remain Resilient
Claims of recession are unfounded. Recession requires consecutive quarters of negative growth; India’s trajectory shows the opposite, with real expansion driven by public capex, services, digital infrastructure, and a recovering manufacturing base. Unemployment and inequality challenges persist, but welfare delivery, consumption resilience, and policy buffers (including RBI interventions) have supported stability. The nominal slip is optics, not contraction—India’s growth engine continues to outpace major peers.
Policy Lessons and the Path Forward
This episode serves as a reality check on the gap between ambitious narratives and ground realities. Government achievements—GST, insolvency reforms, infrastructure push, and digital public goods—have lifted potential growth. Yet the rupee’s slide and nominal ranking drop expose unfinished tasks: reducing oil and import dependence, diversifying exports, deepening capital markets for stable inflows, and accelerating productivity-enhancing reforms.
Nominal GDP targets like $5 trillion remain aspirational but have been delayed by currency arithmetic. Rhetoric must align more closely with resilient fundamentals rather than short-term rankings. Bridging the nominal-PPP gap requires focusing on quality growth: job creation, manufacturing scale-up, energy security, and inclusive development. The rupee’s depreciation is a symptom of transition challenges, not a fatal flaw. India’s third-place PPP standing affirms substantial underlying strength; converting that into sustained nominal momentum and higher living standards will define success in the coming decade.
In sum, the slip to sixth is temporary and largely technical—driven by rupee weakness from import pressures, capital outflows, and global headwinds, compounded by data revisions. It does not signal economic decline but calls for addressing structural vulnerabilities. With continued real growth leadership and PPP resilience, India retains a strong foundation to reclaim higher nominal ranks, provided policies prioritize competitiveness and stability over headline optics.